Designing intuitive infographics is all about channelling chaotic information into something understandable and digestible. Something that educates and even entertains your audience.
Ill-behaving charts, text rendering oddly when it looks fine on screen, pixelated icons when you change the size, layouts that make less sense the more information you cram into them.
If you’ve experienced misery trying to smooth out these petty details at the expense of actually telling your story with data-driven infographics, then raise your hand.
You’re not suffering from a lack of creativity. You’ve just got the wrong tool for the job. Some tools are quick and easy to use but limiting when it comes to conceptualising and creating infographics. Others are extremely versatile but have a ton of upfront learning.
Teams have to consider collaboration, brand guidelines, desired outputs, deadlines, and which tool will generate a “Wow, that looks expensive!” graphic. Picking the wrong option can make an otherwise simple infographic feel like a daunting, compromised process.
So today, let’s dive into the options available to you. Below we outline what we believe are the best digital tools for creating infographics.
1. Adobe Illustrator
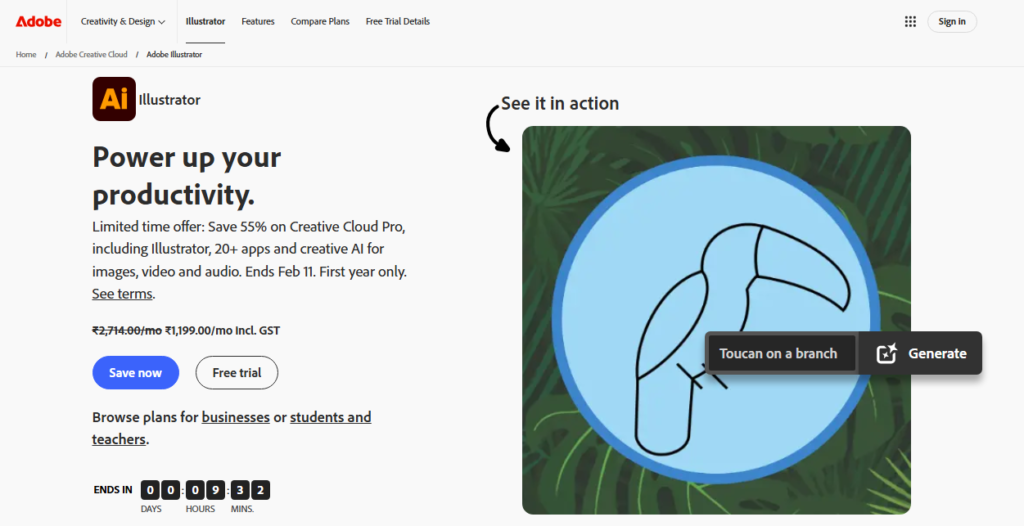
Adobe Illustrator is the industry standard for creating infographics. Designers, publishers and marketers rely on Illustrator when they need pixel-perfect control and flexibility to turn data and concepts into eye-catching visuals. With Adobe Illustrator’s student offer, emerging designers can access the same professional-grade infographic tools used by top designers and publishers.
Whether it’s simple charts or richly-detailed editorial graphics, chances are if you need your infographic to look professional or be highly scalable, you’ll want to create it in Adobe Illustrator.
Why Adobe Illustrator Is Ideal for Infographics
Infographics require a large amount of flexibility when designing. Data needs to flow across the graphic in a way that creates information hierarchy and keeps your readers interested. Using Adobe Illustrator’s powerful vector design tools you can create point-precise infographics with scalable charts, icons, custom typography and illustrations.
Infographics also need to look great at any size. Whether you’re creating a graphic for social media or something you need to print out and pin to a wall, your infographic needs to display perfectly at any scale. Scalability is one of Illustrator’s strengths. Whatever you create in Illustrator will retain its quality no matter how much you zoom in or resize.
Lastly, when designing infographics you want complete control. Whilst there are plenty of free tools that offer infographic templates, these can often limit you when you’re designing something custom. Whether you need to adhere to brand guidelines or create an infographic that aligns to your publication’s style guide, Illustrator will give you the flexibility and control you need.
Best Use Cases for Adobe Illustrator
Adobe Illustrator is best used when creating infographics with lots of data. Since Illustrator allows you to create detailed designs with complete control over layout and formatting, it’s ideal for creating complex infographics that include lots of information without looking cluttered.
If you need to create an infographic that follows detailed brand guidelines with custom colour palettes and design styles, your team will likely want to use Illustrator. Platforms that give you ease-of-use instead sacrifice that level of control for you and your brand.
Illustrator is also a great choice when creating infographics for editorial use. Whether you’re creating something for a digital publisher, print magazine or a download centre on your website, creating your infographic in Illustrator will help ensure it meets the quality you need.
Key benefits:
- Industry-standard vector tools for pixel-perfect infographics.
- Complete creative control over layout, typography, and icons.
- Highly scalable designs suitable for print and digital.
2. Canva
Canva requires nothing more than dragging and dropping whatever you’d like onto your design. In minutes, you’ll have taken your idea and made it into a gorgeous picture. Because Canva has pre-made templates and stock graphics you can create professional infographics with no prior design experience.
Need an infographic for social media fast? Canva will let you and your team crank out gorgeous graphics formatted perfectly for Instagram, LinkedIn, or Facebook. Even if you’re a small team or don’t have designers on staff Canva can help you create polished, professional visuals quickly.
On top of being fast and easy Canva is another great example of graphic design driving modern brand success in the digital age. It allows you to create brand-consistent, eye-catching content at the pace necessary to keep your customers engaged on several platforms.
When Canva Works Best
The ideal use case for Canva is when you need infographic creation that is quick, easy, and on brand. Social media graphics, last-minute marketing pieces, or internal communications that need that extra something can be created beautifully on Canva without much of a learning curve. If you are a small team or don’t have designer resources, Canva will allow you to whip out stunning, on-brand infographics in no time.
Key benefits:
- Drag-and-drop simplicity for fast infographic creation.
- Pre-made templates and stock graphics for quick, polished results.
- Ideal for small teams or non-designers needing on-brand content.
3. Figma
Figma allows creation and editing of designs using vector art tools such as text, shapes, icons, images, layout grids, prototyping and more. Since Figma operates natively in your browser there is no installation or hardware required, and files are automatically saved to the cloud.
Features like plugins and design libraries allow you to easily reuse components, create and apply brand styles and keep projects well organised and easy to scale.
Figma aims to be easy to use for professional designers as well as novices with complete creative control while automating much of the complicated overhead of traditional design programs.
Why Designers Use Figma for Infographics
Designers choose Figma to simplify workflow no matter the size of their teams. Real-time editing allows for everyone to stay on the same page, while native prototyping and responsive scaling features allow for infographics that can be published online or used as part of an interactive project. Figma shines for designing anything with a web focus or product focus.
It’s consistently ranked as one of the top collaboration tools for remote teams for this reason. Designers also turn to Figma when creating graphics with a heavier digital focus like web-based infographics or product visuals that require interactivity or responsive scaling.
Key benefits:
- Cloud-based platform with real-time collaboration.
- Vector-based tools plus prototyping and responsive layouts.
- Supports interactive and web-focused infographics, perfect for teams.
4. Piktochart
Piktochart has pre-made templates, drag-and-drop tools, and charts/graphs already built in so you can easily construct your layout. Mix and match colours, fonts, icons, and graphics while creating customizable designs that stay organised using grid structures for a polished professional look.
You can make your infographics interactive or printable with Piktochart as well. With its user-friendly interface and comprehensive toolset, even individuals who lack formal graphic design experience can create crisp visuals with Piktochart while having complete control of their layout, style, and data.
Best Infographic Formats for Piktochart
Reports, presentations, and classroom slides are ideal formats to use on Piktochart. Its charts and graphs make it easy to see how something can work for displaying data in your organisation or industry.
Need to create a report for your team or management? Slides for a webinar? Teaching materials for the classroom? Piktochart has you covered.
Key benefits:
- Structured layouts, grids, and charts for data-heavy graphics.
- Templates and tools make complex information easy to visualise.
- User-friendly interface for non-designers producing professional results.
5. Venngage
Venngage is an infographic platform that empowers teams to create beautiful infographics fast with zero design skills.
As a graphic design platform built online, Venngage gives you thousands of templates for business, marketing, and education graphics (charts, icons, and brand assets included).
Their platform also includes smart graphics and automation features to help teams automate repetitive design tasks and scale brand-aligned graphics across the business.
This platform is a great example of how you can revolutionise marketing with AI because it allows teams to create powerful infographics faster than ever before.
Instead of reinventing the wheel with each new graphic, teams can choose from pre-made templates and customise them to fit their brand and story.
Ideal Use Cases for Venngage
Venngage is great for internal communications that need visuals to help relay processes, reports, or updates.
Another common use is marketing and sales assets, teams love Venngage to create beautiful infographics, social graphics, and presentations that help strengthen their messaging and funnel marketing teams who may not have an in-house graphic designer.
Key benefits:
- Extensive templates for business, marketing, and educational graphics.
- Smart graphics and automation streamline repetitive tasks.
- Supports brand-aligned visuals quickly, demonstrating AI-enhanced workflows.
How to Choose the Best Infographic Tool for your Campaigns
Ultimately, the best infographic tool for you will depend on your skill level, your needs, and what kind of visual you’re looking to design. Do you want complete control over every detail of your infographic?
Are you a seasoned designer working with detailed, brand-specific graphics? If so, a graphic design program like Adobe Illustrator will give you the scalability you need for both print and digital media. Want to whip up a new graphic in a few minutes?
Canva and Venngage both have a number of templates and resources that make it easy for anyone to create eye-catching infographics.
Keep in mind what you’re designing for as well. Are your graphics going on social media? Will you be presenting them to clients? Will you use them in a digital report? Or are you printing them out for a billboard?
Some programs work better for print or static graphics, while others are optimised for responsive designs. Data-heavy infographics like charts and reports may benefit from different resources than something like an interactive explainer graphic.
Consider your expertise, your need for design flexibility, and your publishing needs to find a tool that fits your needs and helps your idea shine.