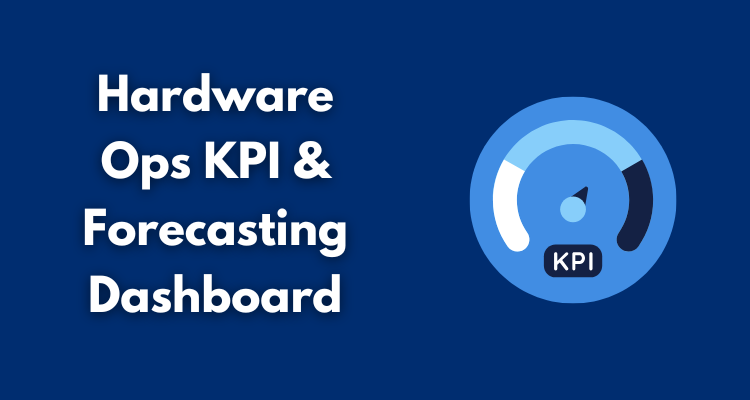
For IT and operations leaders managing distributed teams, hardware management shapes onboarding speed, budget control, and asset readiness. Without tracking the right metrics, stock runs out and costs rise.
A scalable KPI and forecasting dashboard brings all performance and demand data together. It shows current hardware status, forecasts needs from hiring plans, and guides timely purchases.
In this article, you’ll learn which metrics to track and how to connect them to hiring plans. You’ll also get a clear, step-by-step framework for building a KPI and forecasting dashboard that works for both executive decision-making and daily operations.
TL;DR: Steps to Building Your Scalable KPI & Forecasting Dashboard
Here’s a checklist of key steps for building a scalable KPI and forecasting dashboard that supports daily operations and long-term planning:
- Define metrics and data sources: Identify the KPIs that matter most and where each data point comes from.
- Map forecasting inputs to hiring and refresh plans: Link headcount growth and refresh cycles to hardware demand.
- Configure anomaly alerts: Set thresholds for stockouts, cost overruns, and delivery delays.
- Build lifecycle tracking stages: Create clear stages from procurement to disposal for accurate asset visibility.
- Integrate systems for real-time updates: Connect procurement, finance, and asset management tools through APIs.
- Design role-specific views: Provide executives with summaries and teams with operational details.
- Review and iterate quarterly: Adjust metrics, alerts, and views based on changes in hiring, vendors, or budgets.
Core Metrics That Drive Hardware Ops Decisions
In 2024, EMA Research reported that unplanned downtime costs businesses over $14,000 each minute on average. That’s the price of delays from slow procurement, idle assets, or hardware failures.
Here are the core metrics to track to reduce those costs:
Lead Times
Lead time is the total time from when a purchase request is approved to when the device is ready for use. In a distributed team, it includes ordering, supplier fulfillment, shipping, configuration, and final delivery to the employee. Long lead times delay onboarding and disrupt project schedules.
Start by noting the date a request is approved and the date the device is deployed. Review this across locations, suppliers, and device types to identify delays. Use the findings to adjust ordering times, set clear delivery targets, and work with vendors who match hiring needs.
Cost Per Device
Cost per device is the total spend from when hardware is requested to when it is ready for an employee. In an IT hardware procurement workflow, this includes the purchase price, shipping, customs, and setup costs like configuration or imaging.
For distributed teams, it can also cover cross-border logistics and last-mile delivery fees. Tracking this number lets you manage budgets, compare suppliers, and decide when to bulk order or source locally.
To measure it:
- Pull procurement data from your purchasing system for a specific device order
- Add the invoice amount to any shipping and import costs recorded by finance
- Include labor or service fees from IT for device setup
- Compare the total cost across suppliers and regions to find price differences
- Use these findings to identify cost spikes and decide whether to order locally or in bulk.
Utilization Rates
Utilization rate shows how much of your hardware is actively in use versus sitting in storage. It reveals whether capital is tied up in idle devices.
Low utilization often means devices are over-purchased or not redeployed after offboarding. High utilization means most devices are serving active users, which keeps spend aligned with actual demand.
For example, if you track 1,000 devices and find that only 750 are assigned to employees, your utilization rate is 75%. If that number falls, you can investigate whether unassigned devices should be redeployed, sold, or retired. Over time, tracking this helps you match hardware purchasing to real usage.
Failure Rate & Mean Time to Repair (MTTR)
Failure rate shows how often devices break or need service. MTTR measures the average time it takes to repair them and return them to use. For IT and operations leaders, both metrics affect:
- Support costs
- Refresh cycle planning
- Accuracy of hardware forecasts
High failure rates increase workload for support teams, delay projects, and raise replacement spend. Long repair times limit device availability and can cause stockouts.
For example, if 20 devices out of 500 fail in a quarter, the failure rate is 4%. If it takes an average of five days to repair each one, MTTR is five days. Tracking these figures helps you decide when to replace models, adjust support capacity, or keep more spares on hand.
Setting Up Alerts for Anomalies

Anomalies in hardware operations can create delays, increase costs, and disrupt onboarding schedules. Key anomalies to monitor include:
- Inventory dropping below safety stock: Prevents stockouts and avoids last-minute purchasing.
- Costs exceeding budget thresholds: Flags unexpected spikes in procurement, shipping, or repair costs.
- Lead times exceeding agreed service levels agreements (SLA): Signals that suppliers are not meeting the delivery timelines set in your contract.
Proactive alerts help identify and address issues before they escalate. Here are the main types of alerts to use:
- Real-time notifications: Triggered instantly when thresholds are breached, allowing immediate action.
- Scheduled reports: Sent daily or weekly to review trends and detect emerging risks.
For example, if your inventory drops below safety stock, a real-time alert prompts you to place a replenishment order. If the alert also shows extended lead times, you can switch to a backup supplier to meet upcoming onboarding dates.
Connecting Hardware Demand Forecasting to Hiring Plans
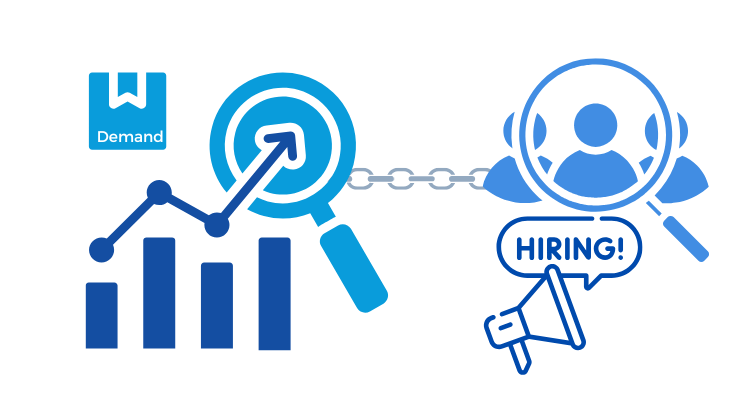
Linking hiring plans to hardware demand helps align your procurement plan with budget cycles and supplier lead times. This approach reduces last-minute orders, prevents stockouts, and keeps onboarding on schedule.
Here’s how to map hiring plans to hardware demand:
- Review hiring forecasts: Use confirmed start dates from HR to identify when devices will be needed.
- Match roles to hardware types: Assign standard device profiles to each role, such as high-spec laptops for developers or dual monitors for designers.
- Factor in lead times: Work with suppliers to understand order and delivery windows, placing orders several weeks or months ahead.
- Account for onboarding surges: Identify periods with multiple hires and consolidate orders to avoid repeated shipping and setup work.
- Plan for spares: Keep a small buffer of ready-to-deploy devices to cover early start dates or unexpected hires.
Tracking Assets Across the Lifecycle
In distributed teams, hardware lifecycle tracking helps control costs, meet compliance requirements, and make the most of every device.
Here are the main stages in an IT asset lifecycle and how they play out in daily operations:
- Procured: The device is purchased and logged in your procurement system. At this point, finance begins tracking asset depreciation from the purchase date. Linking procurement data with asset records gives visibility into total device spend and budget impact.
- In Transit: The device is shipped from the supplier to a warehouse, office, or employee location. Tracking this stage helps spot delays early and adjust onboarding plans.
- Configured: IT team unboxes the device, installs required software, applies security settings, and adds the user profile. Recording this step confirms the device is ready for deployment and meets company standards.
- Deployed: The device is assigned to an employee and marked as active in your asset management platform. This status allows accurate tracking of devices in use versus those available for redeployment.
- In Repair: The device is sent to IT or a service vendor for fixes. Flagging this stage can trigger a loaner device request so the employee can keep working.
- Retired: The device is removed from active use but may be stored for spare parts, redeployment, or resale. Tracking this stage supports refresh planning and inventory accuracy.
- Disposed: The device is securely wiped and processed through an ITAD vendor for recycling or certified destruction. Linking disposal records to procurement history completes the chain of custody for compliance audits.
Integrating Data Feeds Across Teams
Single-source-of-truth reporting allows every team to work from the same, up-to-date information. Without it, procurement may order more devices than needed, finance may miss cost spikes, and operations may not see stock shortages until it is too late.
The core systems to connect are your procurement platform, finance or ERP system, and IT asset management platform. Procurement records flow to finance for payment and budget tracking. Finance data combines with operations data to give a complete view of costs, asset status, and upcoming needs. The dashboard then pulls from all systems to present a unified view for decision-making.
API integrations keep these systems in sync in real time. It reduces manual updates and removes the risk of outdated or conflicting reports.
Building Role-Specific Views
Role-specific views give each stakeholder the right level of detail to act quickly.
Here are the main types of views to include in your dashboard:
Executive Summaries
Executive summaries combine KPIs into a high-level view of budget, performance, and risk. They give leaders a quick way to review trends, spot issues, and guide strategic decisions without digging into operational details.
Operational Views
Operational views present detailed data for IT technicians, procurement staff, and operations managers. They focus on day-to-day actions, such as tracking open purchase orders, monitoring repair queues, or checking device availability.
Key Takeaways
- Track five core metrics to control costs and prevent delays: lead times, cost per device, utilization rates, failure rates, and mean time to repair (MTTR).
- Connect hiring plans to hardware demand by matching roles to device profiles, factoring in supplier lead times, and planning for onboarding surges to avoid last-minute orders.
- Set up proactive alerts for inventory shortages, budget overruns, and SLA breaches to catch problems before they disrupt operations or increase costs.
- Build role-specific dashboard views that give executives high-level summaries for strategic decisions while providing operational teams with detailed data for daily tasks.